Demonstration site of Ulm (Einsingen), Germany
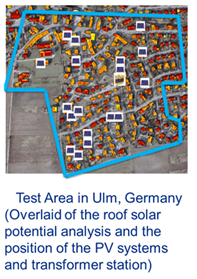 In the demonstration site of Einsingen, in Ulm, PV penetration is of 25%. The high penetration of PV generates an overcapacity in terms of electricity generation which causes the grid and the transformers to overload. In order to deal with surplus of electricity the network operator needs to invest in the upgrade of the grid. The cooperative control strategies developed within the OrPHEuS project can represent a valid alternative to reduce the grid costs and in parallel to convert the PV electricity in other forms of sustainable energy.
| Ulm-Einsingen Households PV systems PV power [kWp] Load [MWh] PV energy [MWh] PV share (year) |
2013 134 21 233 1.047 230 25 % |
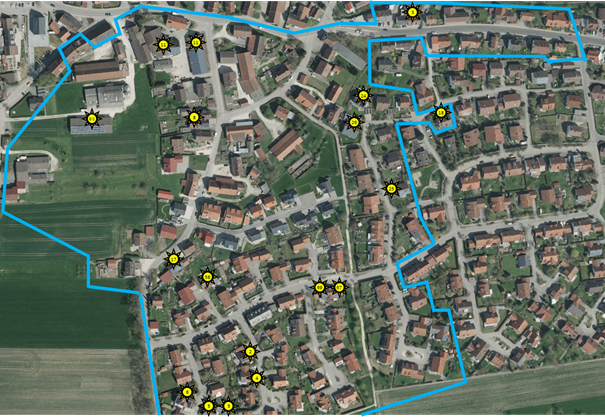
So far, the current electricity system control strategies and the balancing of the grid are responsibilities of the transmission system operators. With increasing shares of decentralized energy input in the low voltage network the distribution gird operators get into a new role. Right now the grid codes for low voltage grid (VDE AR4105) in Germany ask for several services to be supplied by decentralized energy systems connected to the low voltage grid.
Figure 1 - Einsingen low voltage network model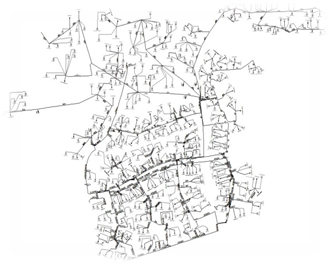
- Frequency stabilization: starting from 50.2 Hz active systems connected to the low voltage grid have to decrease the active power with a defined slope to help stabilizing the grid in the case of missing load.
- Voltage stabilization: depending on the voltage situation, active systems have to provide reactive power to reduce the line voltage. The characteristic is defined locally by the grid operator.
- Feed in management: the renewable energy systems connected to the grid with a power above 1 kW have to reduce the active power from 100% to 60%, 30% or 0% in the case the grid operator send a signal for power reduction to one of the stated levels. The renewable energy system owner has to provide the technology / communication device. The grid operator defines the way in which he indicates the actual level of the feed in management. The system with installed power from 100kW has to provide also a signal with the actual power fed into the grid.
Figure 2 - Reverse Energy Flow at Distribution Level
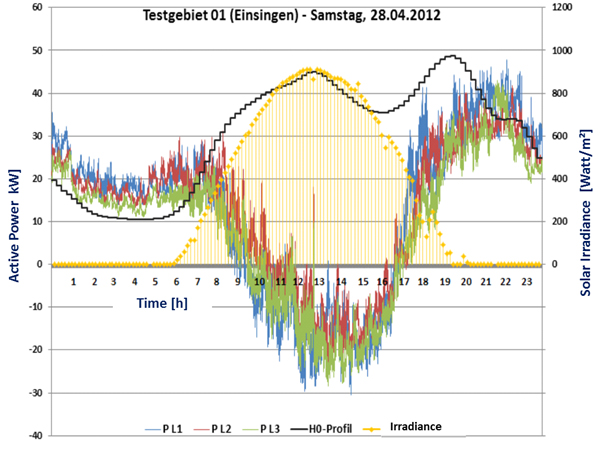 Source: G. Heilscher, H. Ruf: Ulm University of Applied Sciences, 2012
The graph above exemplifies the reverser energy flow at the transformer to be analysed in the demonstration site of Einsingen, Ulm. The black line indicates the average load curve of the 134 household and the yellow background represents the quarter hourly solar radiation at the test site. The load measured at the low voltage transformer drops during daytime due to feed in of solar power (1 second resolution). Between 9 AM and 5 PM it is possible to see that the load flow is reverse at the transformer.
Within the OrPHEuS project, innovative control strategies were designed and simulated to deal with the problems faced by Ulm, in order to develop new business models to be applied elsewhere.
Solutions were developed under the conditions of the Cooperative green supplier, Green Community and Carbon-free heating strategies. One of the possibilities analysed in the project is to use the surplus of PV electricity to generate thermal energy to be used locally by the means of local thermal storage.

